Percent Positive Close Days
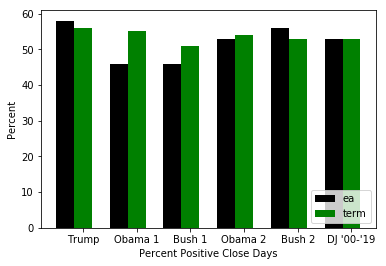
This bar chart shows the percentage of days that the stock market's closing point was positive. This graph is laid out to compare the first term of each president side by side, the second term of the two presidents side by side, and the Dow Jones Index from January 3, 2001 through September 27, 2019.

The black bars (labeled "ea") show the time period from "election to inauguration" for each President's election cycle, where 1 is their first term election and 2 is their second term election.
The green bar (labeled "term") shows the time period from inauguration day through their last day in office for each President's term, where 1 is their first term and 2 is their second term.
Especially for the green bars (Presidential terms), the means are very similar across all presidents and with the Dow Jones Index, resulting in the conclusion, from this data plus other data, that the President doesn't measureably affect the stock market.