Daily Change
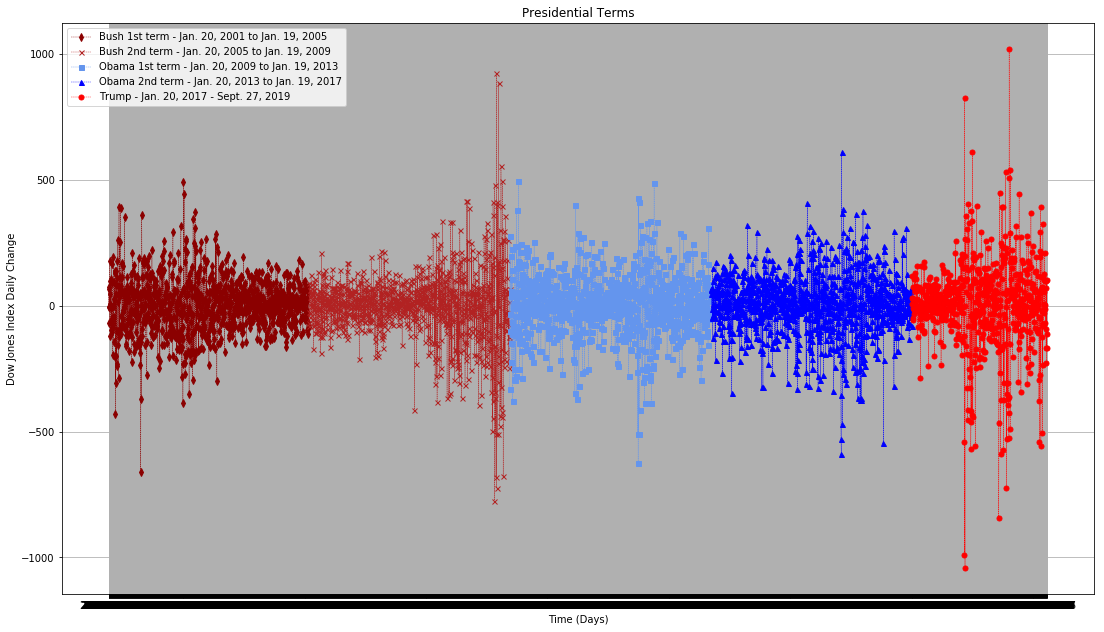
This graph shows the closing stock value minus the opening stock value for each day from January 20, 2001 through September 27, 2019.
This graph is color-coded, by Presidential term, as shown by the legend in the top left of the graph.
This graph shows the closing stock value minus the opening stock value for each day from January 20, 2001 through September 27, 2019.
This graph is color-coded, by Presidential term, as shown by the legend in the top left of the graph.