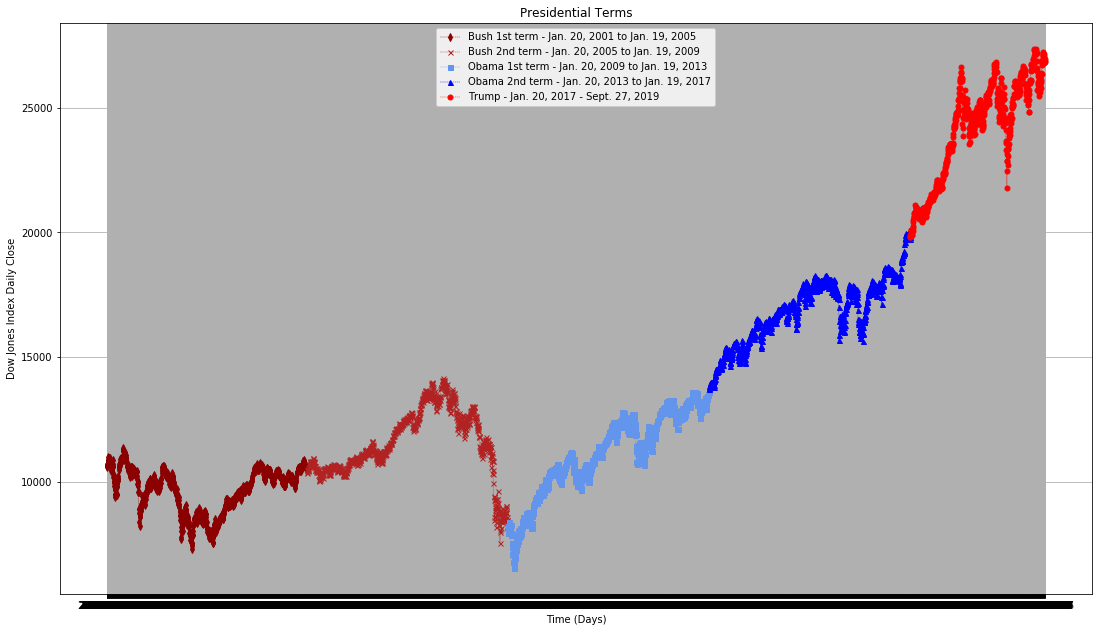
Daily Close
This graph shows the daily closing value of the stock market's Dow Jones Index. You may have seen a graph very similar to this on the news, online, or in a paper.
This particular graph is color-coded, by Presidential term, as shown by the legend in the top middle of the graph. The data is plotted from January 20, 2001 through September 27, 2019.